Use noise maps in your concept development phase to help evaluate project alternatives. High resolution georeferenced countour maps of transportation noise can be generated across large or small areas. Noise values represent the effect of average daytime traffic volumes, approximated by samples from roads with similar profiles.
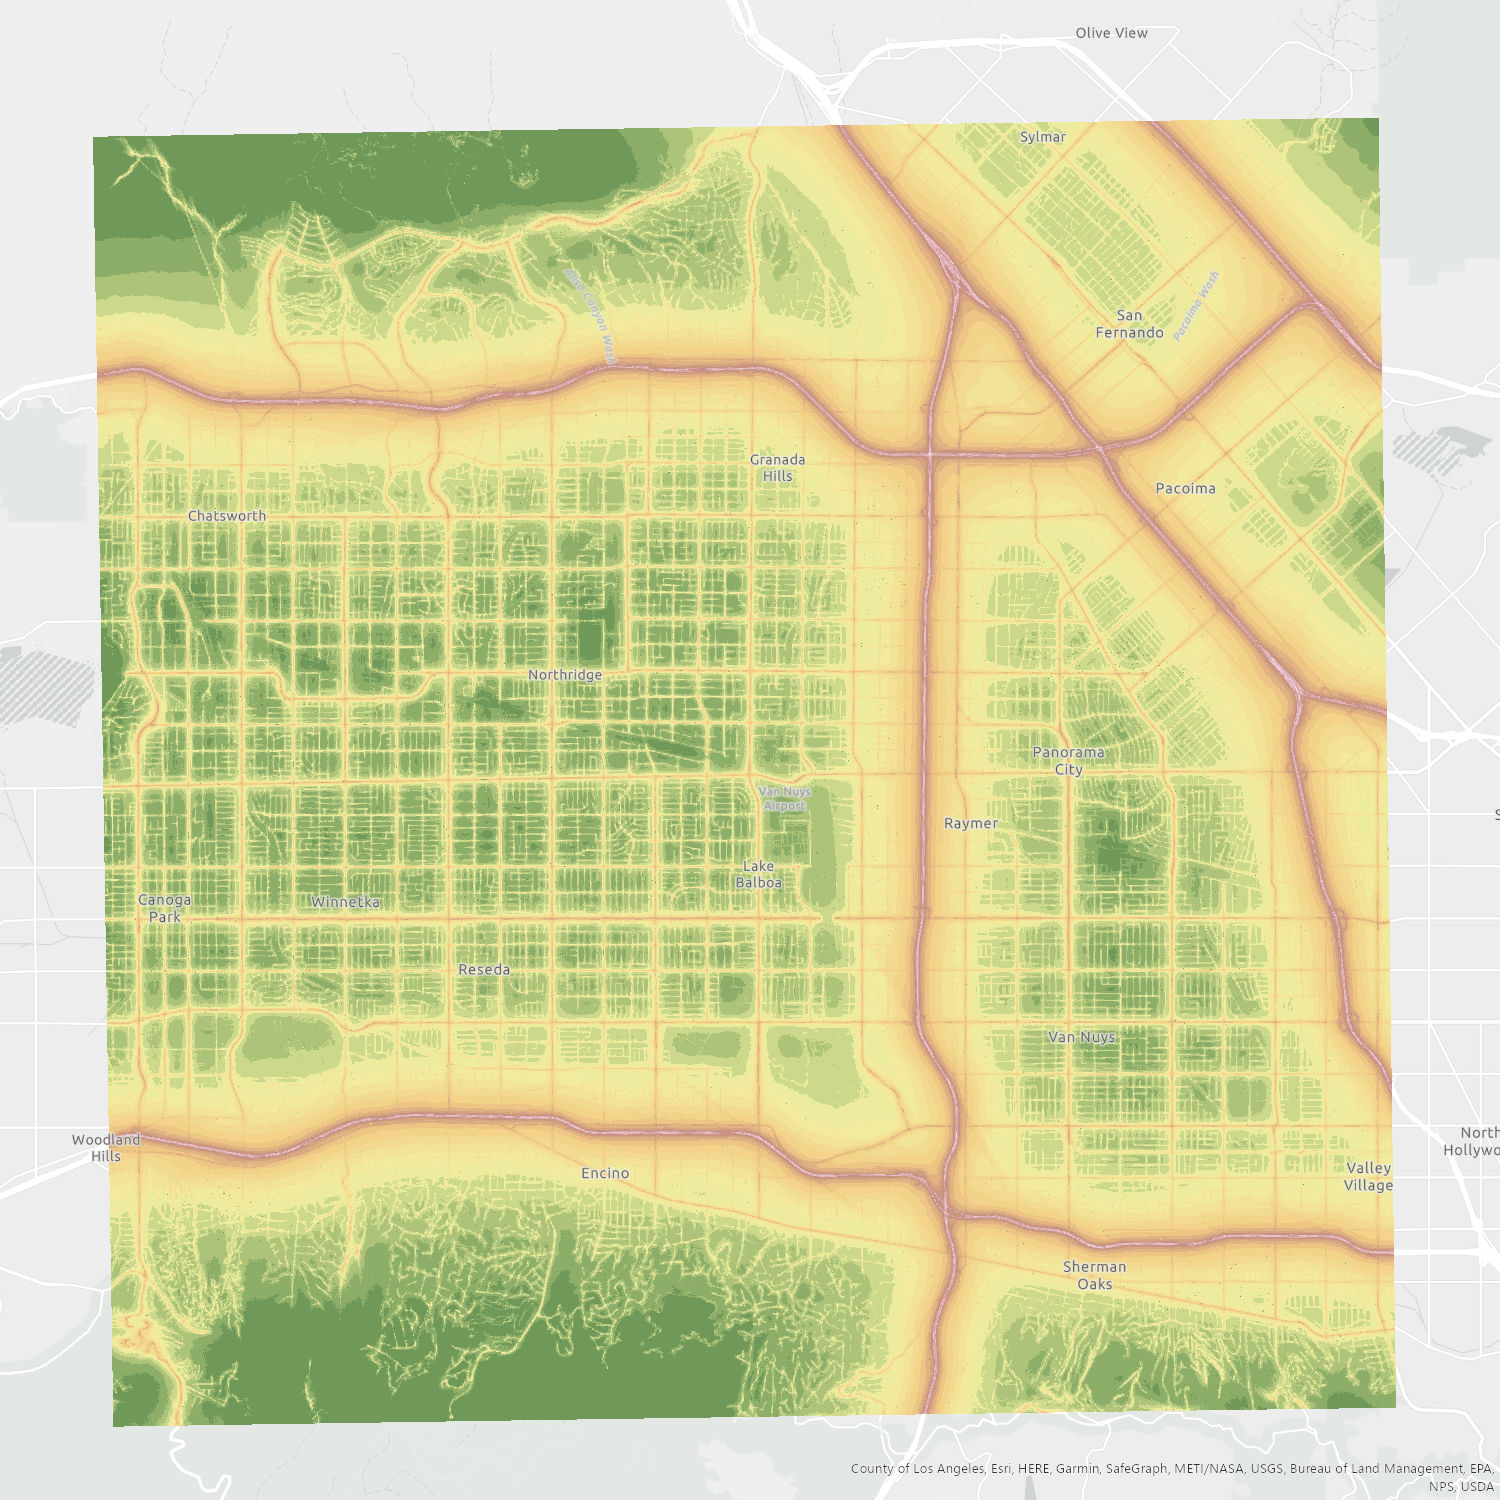
Maps can be generated for areas of various size: city-wide, local area, project area, or anywhere in between. The following is an example of a city-wide map.
- Area
- 20km X 20km
- Resolution
- 10 meter pixels
- Type
- Road noise
- Resolution
- 10 meter pixels
- Type
- Rail noise
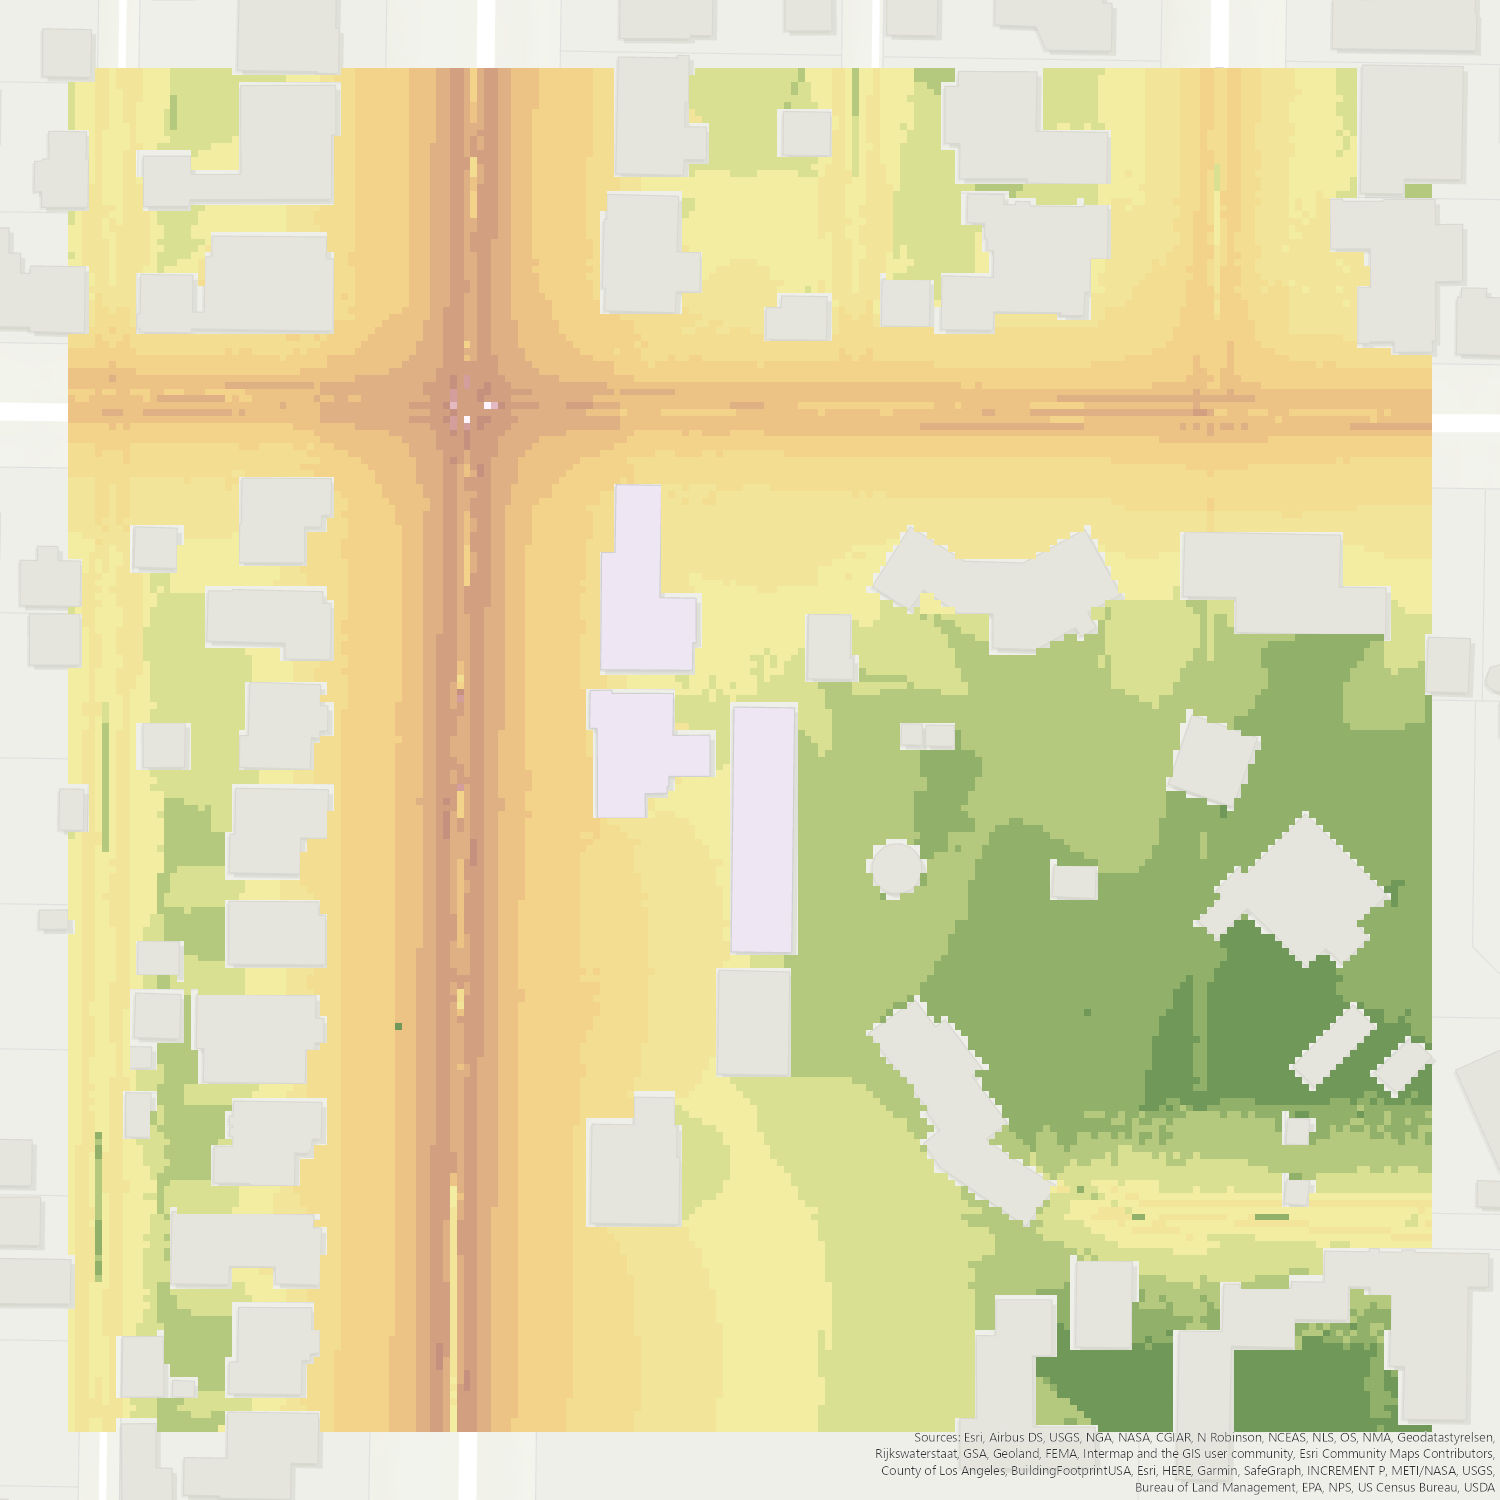
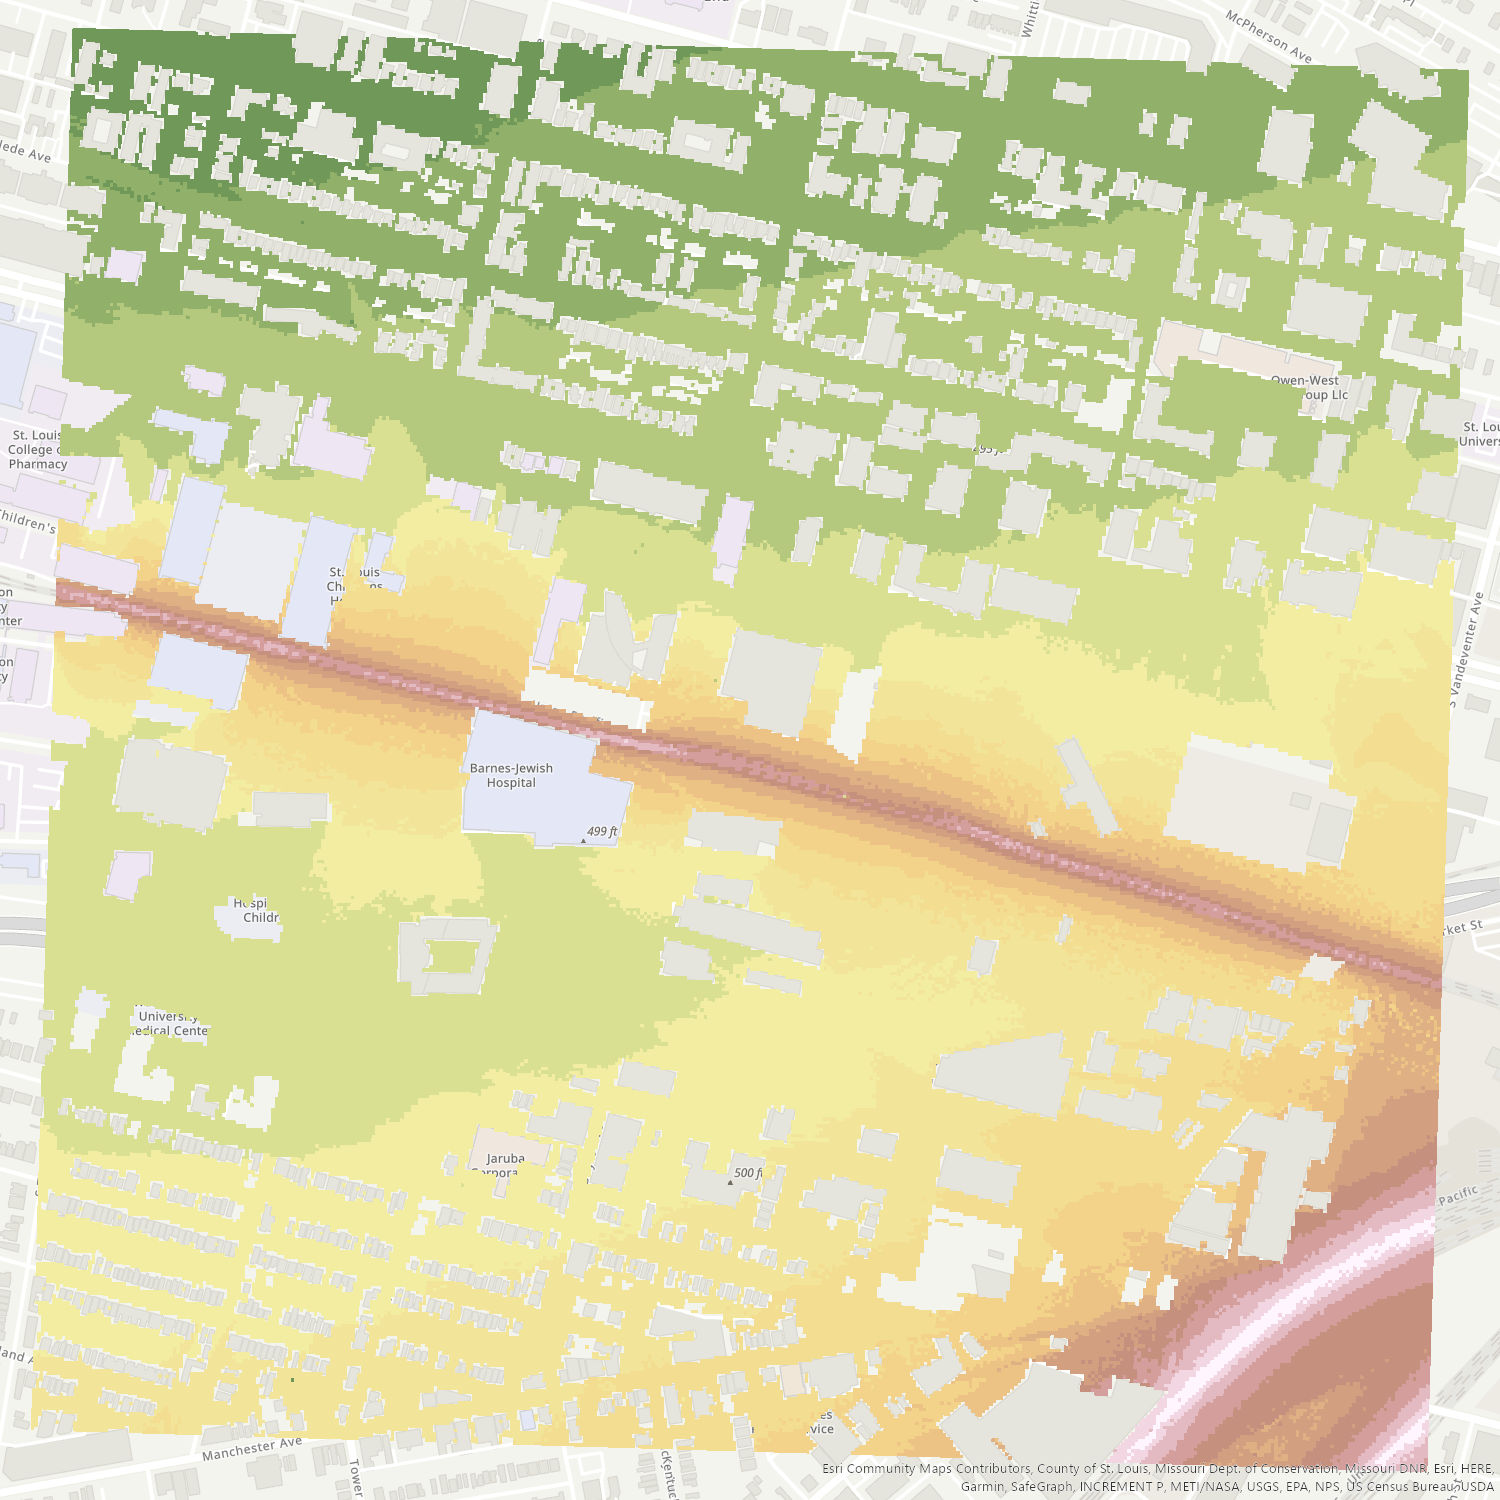
The noise estimation model features an ability to calculate the sound attenuation due to solid structures. This capability helps identify "noise shadows" behind buildings and solid structures.
- Area
- 400m X 400m
- Resolution
- 4 meter pixels
- Type
- Road noise
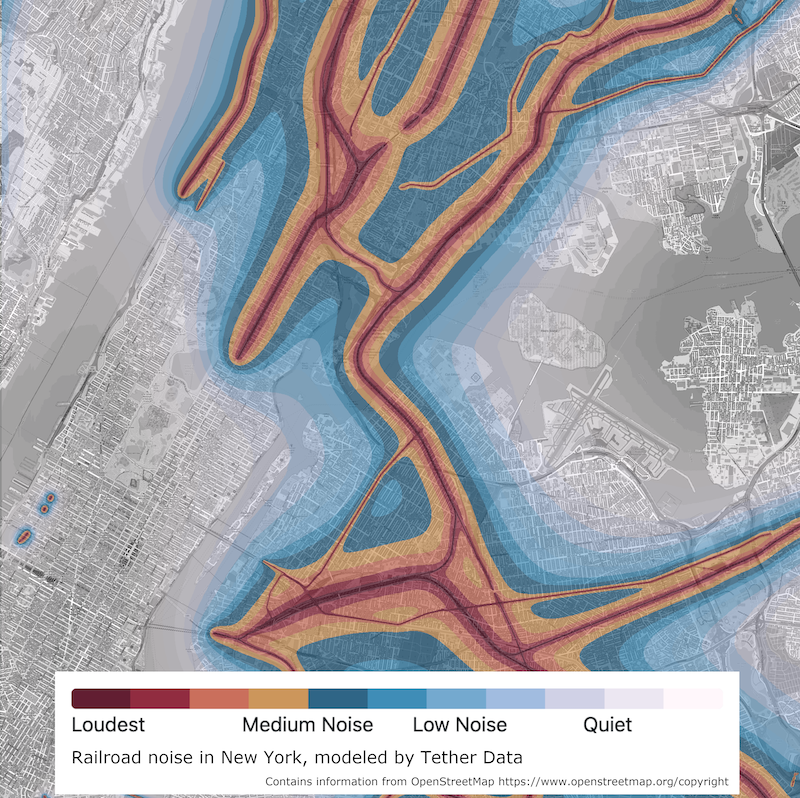
Railroad noise maps can also be generated, representing the noise envionment when a train is passing. This example shows the noise due to both light and heavy rail across the same area as the previous example.
- Area
- 400m X 400m
- Resolution
- 4 meter pixels
- Type
- Rail noise
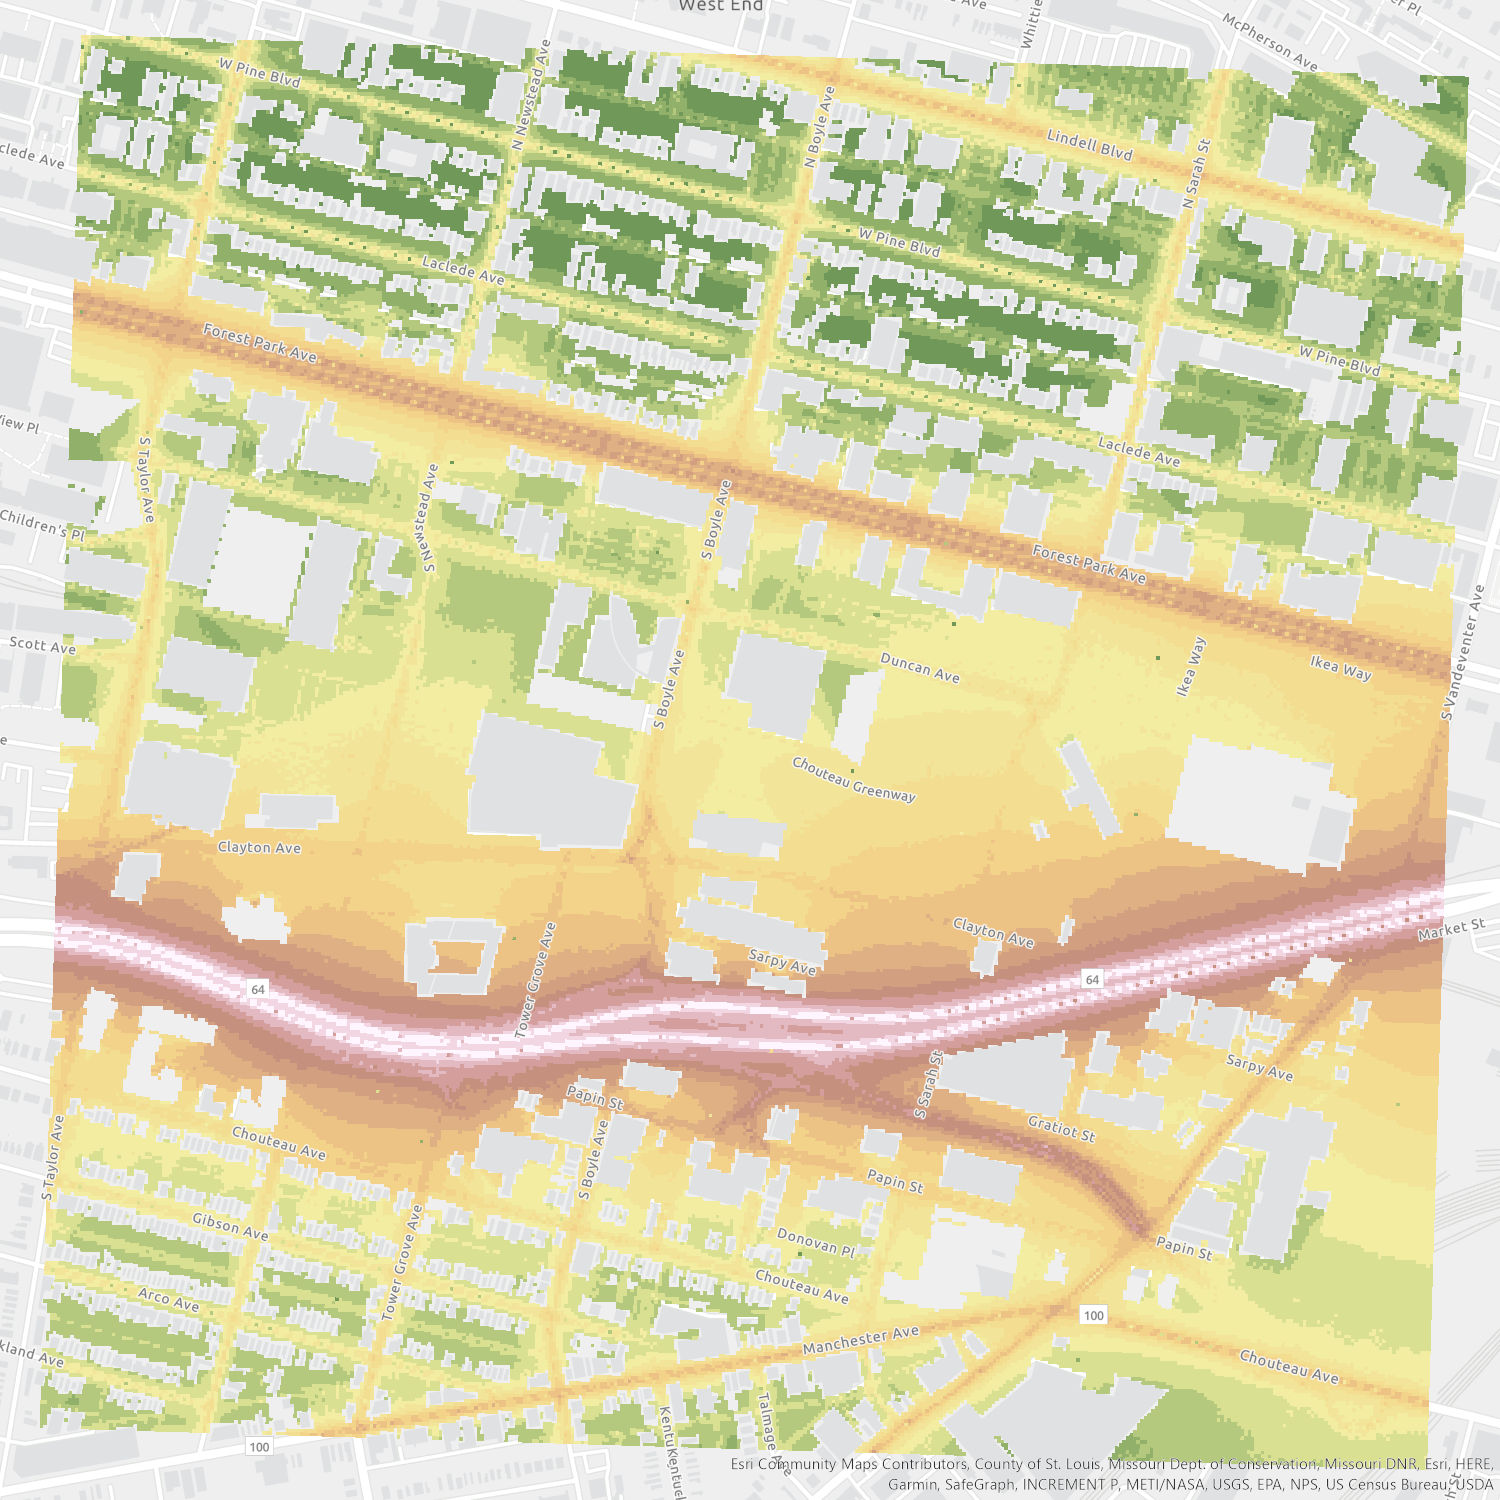
Enables planners and project teams to be more creative in how they approach projects. With more detailed information and early estimates, teams are able to showcase more innovation, highlight alternatives, and help differentiate your proposals.
- Area
- 200m X 200m
- Resolution
- 1 meter pixels
- Type
- Road noise